Liberation Day
On April 2, 2025, commonly known now as “Liberation Day”, President Trump unveiled a broad tariff proposal that included a 10% universal tariff on all U.S. imports and substantial tariff increases for over 25 major trading partners. Although Trump later announced a 90-day delay on implementing the new tariff policy, the potential increase has generated significant uncertainty globally and a drawdown in U.S. equity prices.
Prior to Liberation Day, the March U.S. Composite PMI rose to 53.5 from 51.6(1), signaling continued economic expansion. After Liberation Day, U.S. GDP growth projections were revised sharply downward, moving from ~2.5% to ~0.5%(2)(3).
U.S. Monetary Policy
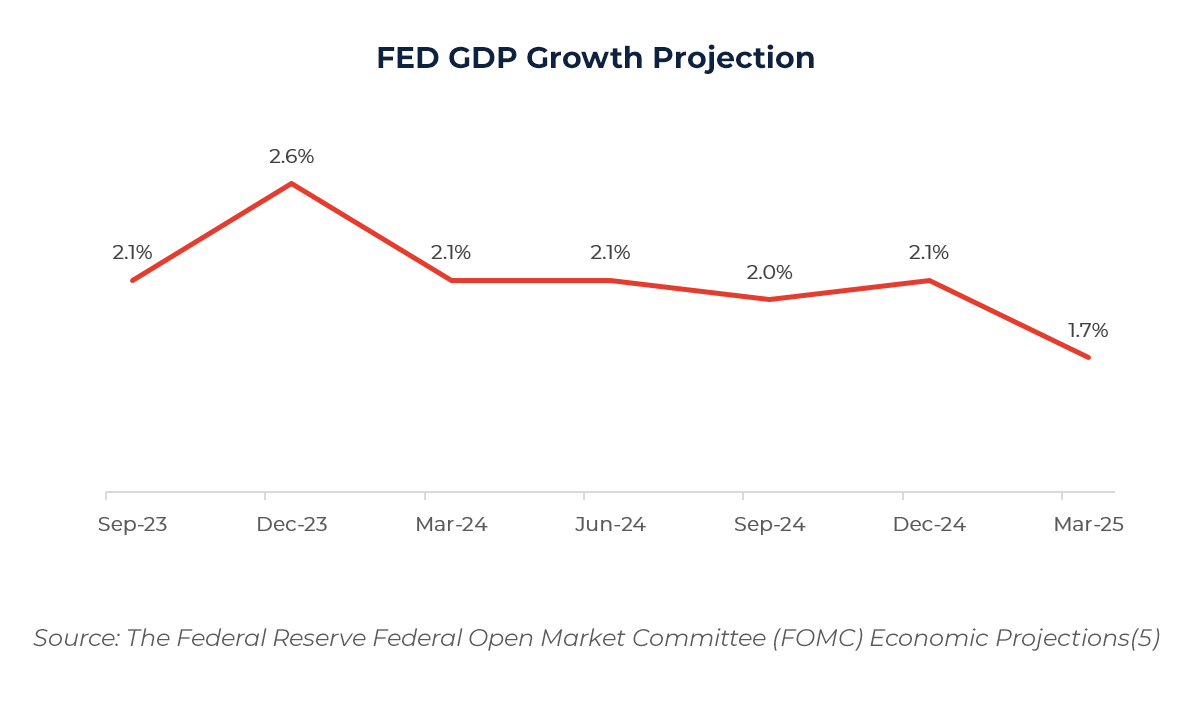
After cutting rates by 100bps over the last three FOMC meetings in 2024, the Federal Reserve has maintained the federal funds rate at 4.25% – 4.50% throughout 2025. In the March meeting, the Federal Reserve revised its 2025 economic projections downward, forecasting lower growth (1.7% from 2.1%) and higher inflation (2.7% from 2.5%)(4).
 Market Overview
Global equity markets had a mixed start to 2025. In Europe, equities showed resilience early in the quarter, supported by EU fiscal reforms, policy easing expectations, and strong corporate earnings(6). In Asia Pacific, China and South Korea delivered solid performance driven by outperformance among large cap companies(7). Small cap and mid cap companies lagged due to outsized concerns over trade uncertainties and inflation.
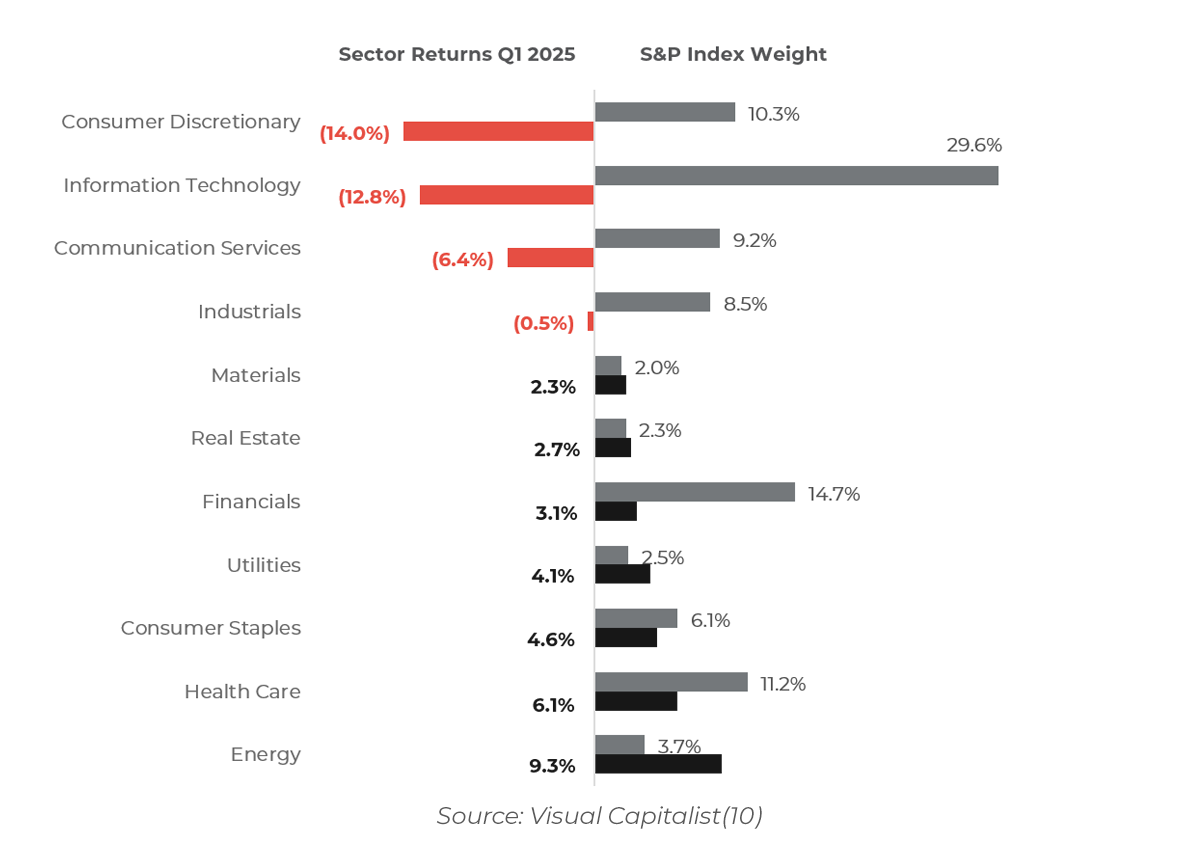
The U.S. equity market started 2025 with strong momentum, supported by easing inflation, a resilient labor market, and enthusiasm around artificial intelligence. However, escalating concerns over shifting trade policies quickly dampened sentiment. The S&P 500 finished Q1 down 4.6%, marking its worst quarterly performance since Q3 2022(8). The index is currently down 10%+ from its all-time highs(9). Technology and consumer discretionary sectors led the declines, as these sectors were weighed down by valuation concerns and the anticipated negative impact of trade-related disruptions on consumer demand and margins. In contrast, defensive sectors like healthcare, consumer staples, and utilities performed strongly, reflecting growing investor caution(10).
As equity markets pulled back, fixed income assets came back into favor. The Bloomberg U.S. Aggregate Bond Index rose 2.8% for the quarter, supported by declining U.S. Treasury yields and increased demand for low-risk assets. The 10-year U.S. Treasury yield fell from 4.6% to 4.2%, driven by a risk averse landscape amid heightened trade policy risks(11).
Additionally, commodities outperformed as gold and silver rallied strongly due to investors continuing to seek low-risk assets amidst market uncertainty. Industrial metals, particularly copper, also performed strongly as supply concerns pushed prices higher. Energy markets posted moderate gains, with natural gas prices surging despite softness in oil prices. Agricultural commodities were mixed, with cocoa prices declining sharply, while coffee and sugar registered gains(12).
The U.S. dollar weakened broadly, reversing its strong 2024 performance. The U.S. Dollar Index fell approximately 4% in April and has declined about 9% year-to-date(13). Weaker U.S. growth prospects, escalating trade tensions, and rising expectations for global monetary easing contributed to the shift.
IPO Market
Global IPO activity showed cautious resilience in Q1 2025, with 291 IPOs raising $29.3B. Asia-Pacific led by deal volume, supported by Hong Kong and South Korea, while EMEIA activity declined modestly, and Europe remained stable. The U.S. IPO market priced 62 deals raising $8.9B, a 51% increase in volume year-over-year. TMT and healthcare sectors dominated activity, led by notable deals such as Venture Global ($1.8B, NYSE) and CoreWeave ($1.5B, NASDAQ). Cross-border listings remained strong, making up 58% of U.S. IPOs(14).
Author:
Andrew Bell
Director
Author:
Max Mosbacher
Vice President
References
(1) S&P Global (2025): S&P Global Flash US PMI. Available: S&P Global Flash US PMI @ March 2025
(2) Goldman Sachs (2025): Tariff-Induced Recession Risk, Research Report. Available: Tariff-Induced Recession Risk
(3) Goldman Sachs (2024): US Outlook 2025: New Policies, Similar Path. Available: US Economics Analyst 2025 US Economic Outlook New Policies, Similar Path (Mericle)
(4) Federal Reserve Board (2025): Summary of Economic Projections, March 19, 2025. Available: Summary of Economic Projections, March 19, 2025
(5) Federal Reserve Board (2025): FOMC Economic Projections. Available: The Fed: FOMC Search
(6) Goldman Sachs (2025): Why European stocks are outperforming the US. Available: Why European stocks are outperforming the US | Goldman Sachs
(7) JP Morgan (2025): Review of markets over the first quarter of 2025. Available: Review of markets over the first quarter of 2025 | J.P. Morgan Asset Management
(8) CNN Business (2025): Wall Street is fed up with Trump’s tariffs. Available: Wall Street is fed up with Trump’s tariffs. Stocks are off to their worst start to a year since 2022 | CNN Business
(9) NBC News (2025): Stocks close out their worst quarter since 2022. Available: Stocks close out their worst quarter since 2022 amid tariff uncertainty
(10) Visual Capitalist (2025): Charted: How Every S&P 500 Sector Performed in Q1 2025. Available: Charted: How Every S&P 500 Sector Performed in Q1 2025
(11) Union Bank & Trust (2025): Investment Overview: 1st Quarter 2025. Available: Investment Overview: 1st Quarter 2025 | Union Bank & Trust
(12) VanECK (2025): Commodities’ Powerful Start Amid Global Shifts. Available: Commodities’ Powerful Start Amid Global Shifts | VanEck
(13) Mint Markets (2025): US dollar index slips below 100 for the first time in nearly 2 years. Available: US dollar index slips below 100 for the first time in nearly 2 years
(14) EY (2025): EY Global IPO Trends Q1 2025. Available: EY Global IPO Trends report Q1 2025