Download
Click here to download this article as a .pdf document.
| Executive Summary
Spotting Opportunity Where Others See Regulation
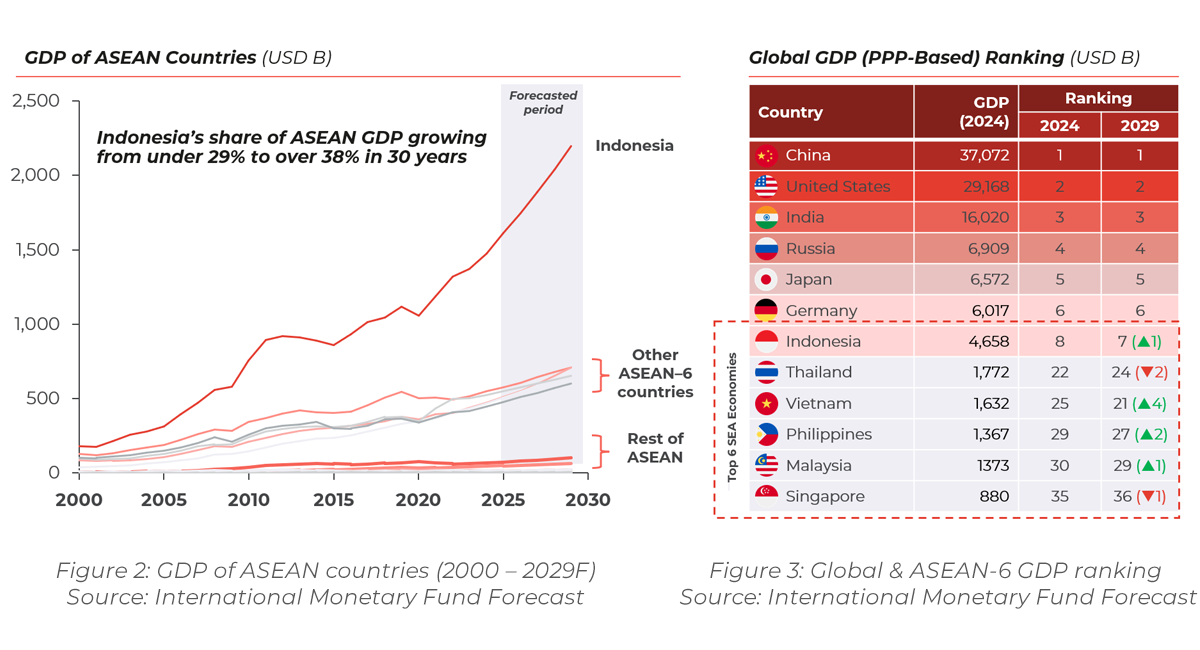
Indonesia is on the verge of becoming Southeast Asia’s industrial anchor. With USD 256 billion in manufacturing output in 2023, the country contributes ca. 35% of ASEAN’s industrial output – while accounting for ca. 41% of the region’s population and ca. 36% of ASEAN GDP, signaling further growth potential. Foreign manufacturers are increasingly drawn to Indonesia’s compelling mix of demographic and economic strength, resource depth and assertive policy direction.
A central lever in this transformation is Indonesia’s local content regulation TKDN, following the narrative that wrote the success stories of other East Asian industrial nations in the second half of the 20th century. Initially suspected more as a compliance burden, TKDN is now understood as a strategic market filter: it determines who can access public tenders, benefit from incentives and embed themselves into Indonesia’s long-term industrial growth.
This paper outlines how TKDN interacts with Indonesia’s broader manufacturing strategy – including cluster formation, sector-specific policies and infrastructure development. It provides international firms with a clear view on how to align their localisation efforts with a market that is rising not just in scale, but in complexity and regulatory maturity.
Top 5 Takeaways for Global Industrial Firms
- Indonesia: ASEAN’s industrial growth engine. Indonesia drives 35%+ of ASEAN’s industrial output while advancing toward becoming the world’s 4th largest consumer market by 2045 and capturing a top-three position in Asia’s EV market (ex-China) by 2030.
- TKDN as market access filter. TKDN regulations unlock critical market access by determining which companies win public tenders, secure financial incentives and establish long-term market positioning through meeting the 30-70% local content thresholds.
- Strategic industrial clusters forming. Indonesia builds specialised industrial clusters from West Java (EVs, electronics) to Sulawesi (nickel, batteries), deliberately replicating China’s proven development path from two decades ago.
- Early movers win. Hyundai and BYD seized early advantages and secured preferential treatment while latecomers like Apple encountered market bans and invested heavily in costly catch-up strategies.
- ASEAN-wide scale via Indonesia. Companies consolidating operations in Indonesia leverage RCEP/AFTA trade benefits while fragmented regional approaches fail to capture both policy advantages and broader market access.
1 | Indonesia: An Emerging Global Manufacturing Powerhouse
Indonesia’s emergence as a global manufacturing hub is driven by a combination of structural advantages and favourable geopolitical momentum as economic activity shifts toward emerging markets and new regional alliances take shape. This external dynamic is reinforced by years of coordinated domestic reforms. The government’s focus on building priority industrial hubs, combined with targeted incentives, is creating increasingly competitive ecosystems. As a result, multinational companies are investing not just in low-cost production, but in higher-value operations and broader value chain integration within Indonesia.
Strategic Trajectory: From Underestimated Giant to Manufacturing Contender
Indonesia, the world’s fourth most populous nation and third largest democracy, comprises the largest global archipelago of over 17,000 islands. Located between the Indian Ocean and the China Sea, it covers vital sea lanes in Southeast Asia.
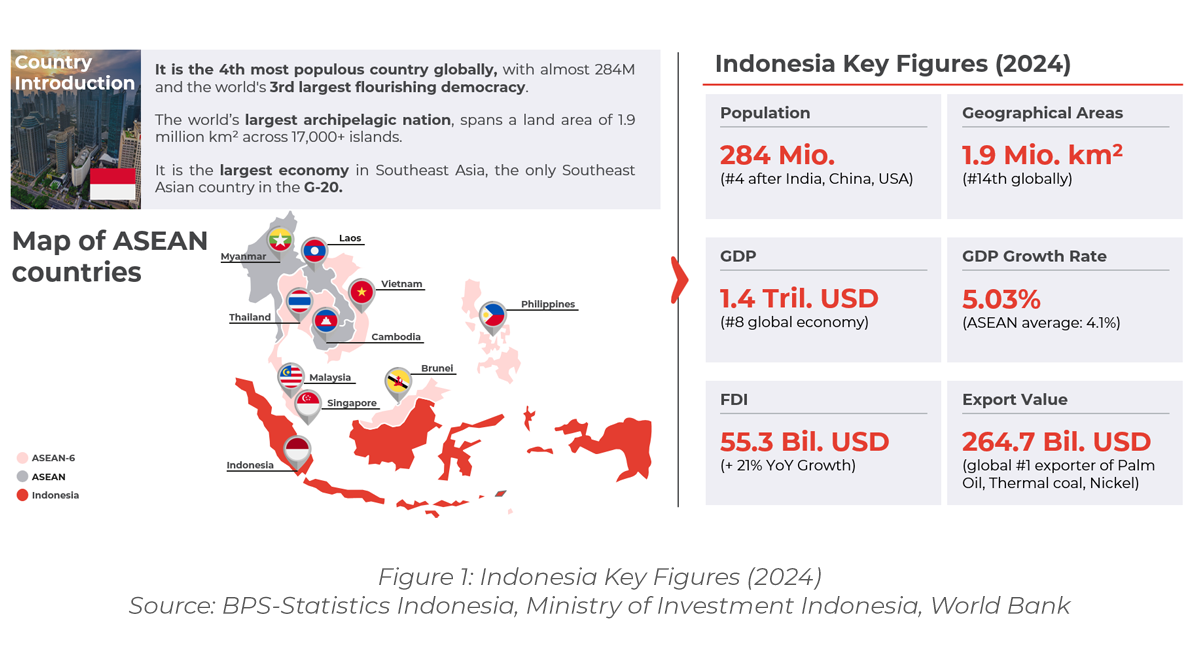
Southeast Asia’s only G-20 member represents more than a third of the region’s economy with 1.4 trillion USD (2024), being the world’s 8th largest economy.
With the World Bank’s forecasted GDP CAGR of 8% from 2024 to 2029, the country is set to become the world’s seven-largest economy by 2029, catching up to long established powers China, USA, India, Japan and Germany (Figure 3).
This trajectory is driven by an increasingly strong manufacturing sector. In 2023, Indonesia ranked #10 globally in manufacturing value, contributing USD 256 billion – more than one-third of ASEAN’s manufacturing output. This placed it far ahead of other key ASEAN nations like Thailand, Vietnam and Malaysia.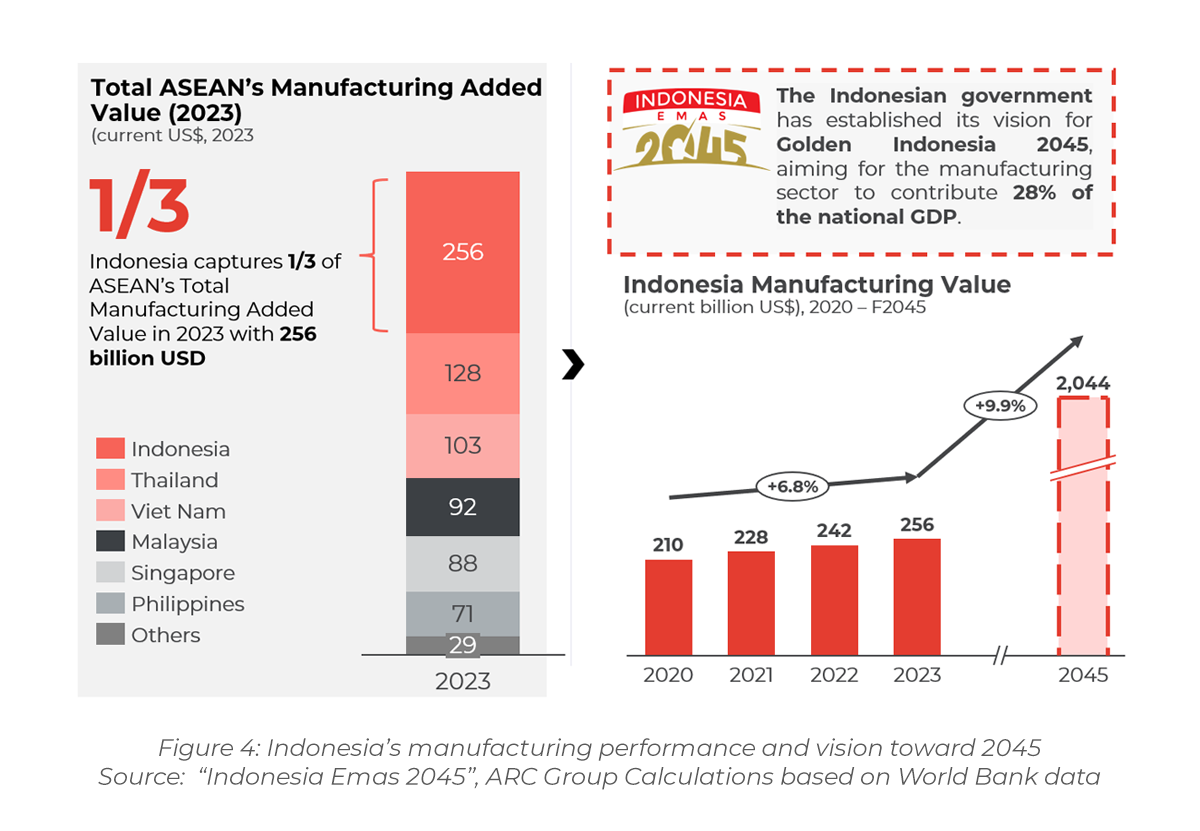
Looking ahead, the Indonesian government has set a bold vision through its Golden Indonesia 2045. By that year, marking the 100th anniversary of its independence, the country aspires for manufacturing to contribute 28% of the national GDP, with projections suggesting the sector could reach a value exceeding USD 2 trillion. This ambition reflects a concerted national effort to transition from commodity-based exports to a diversified, value-driven industrial economy. This trajectory is underpinned by 3 key drivers:
- Resource-to-Value Chain Transition: By banning raw mineral exports and mandating local content requirements, Indonesia is deliberately moving up the value chain – from commodity-based exports to domestically processed goods. This policy shift has accelerated the development of downstream manufacturing and supporting industries, embedding industrialisation deeper into the national economy.
- Strategic Liberalisation for Capital Inflow: Various initiatives and efforts to attract foreign firms to establish local production sites. Notably, the 2021 revision of Indonesia’s new investment list expanded foreign ownership in various sectors, especially mining, to boost foreign direct investment, which opened the opportunities for foreign players to join and bring more value and technologies to the market.
- Infrastructure-led Industrial Enablement: Massive infrastructure programs – including the development of the new capital city Nusantara, the Trans-Sumatra Toll Road and urban mass transit systems – are not merely physical upgrades. They are strategic enablers designed to reduce logistical bottlenecks, enhance connectivity and support the geographic spread of industrial activity across the archipelago.
Furthermore, the country’s massive manufacturing transformation is enabled by its advantages as an extensive market attracting global MNCs to enter, which is enabled by three key structural advantages:
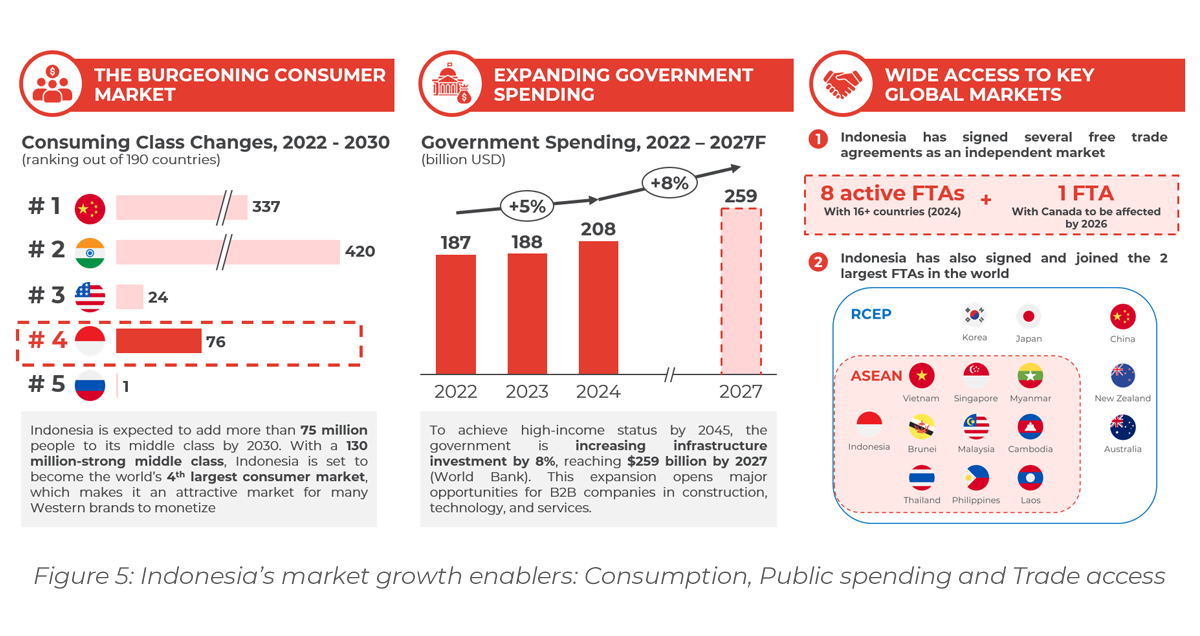
First, Indonesia is supported by a rapidly expanding domestic consumer base. With more than 75 million individuals expected to enter the middle class by 2030, Indonesia is poised to become the world’s fourth-largest consumer market, trailing only China, India and the U.S.
Second, the government is ramping up public expenditure – especially in infrastructure – to sustain long-term industrial growth. By 2027, national government spending is expected to increase by 8% from 2024[1]. Much of this funding is earmarked for infrastructure development, opening opportunities across construction, technology and logistics – critical enablers for manufacturing expansion and supply chain optimisation.
Finally, Indonesia’s deep integration into global trade networks enhances its attractiveness as a trade hub where locally based businesses can export their products to key international markets. The country currently has eight active free trade agreements (FTAs) covering over 16 countries, with a ninth set to include Canada by 2026[2]. Moreover, Indonesia is a signatory to both of the world’s largest trade blocs – RCEP and ASEAN – offering manufacturers preferential access to key markets across Asia-Pacific.
Together, these drivers – industrial momentum, domestic demand growth, fiscal support and international connectivity – position Indonesia not just as a regional leader but as a strategic manufacturing and trade hub in the evolving global economy.
Rising FDI Inflows and the Emergence of Strategic Industrial Clusters
Carried by these tailwinds and decade-long refined pro-industrial policies, Indonesia has firmly positioned itself as ASEAN’s second-largest FDI destination. It recorded growing inflows in 10 out of the last 11 quarters – a testament to its post-COVID resilience and growing relevance in global investment portfolios. In 2024 alone, Indonesia attracted over USD 55.3 billion in FDI, the highest level in recent history[3]. This momentum is fueled by global supply chain reallocation, as investment shifts away from China due to a mix of structural factors – including rising labour costs, slower economic growth and the renewed escalation of global trade tensions.
However, it is important to contextualise these numbers. While Singapore remains the largest recipient of FDI in ASEAN, it also acts as a regional intermediary. A substantial portion of capital inflows into Singapore is eventually redirected into production-heavy economies like Indonesia. As a result, Indonesia’s role in the regional industrial base is more significant than headline figures alone suggest – reflecting growing investor confidence in its long-term competitiveness and capacity for industrial depth.
Strategic Investment Hotspots: Key Provincial Clusters
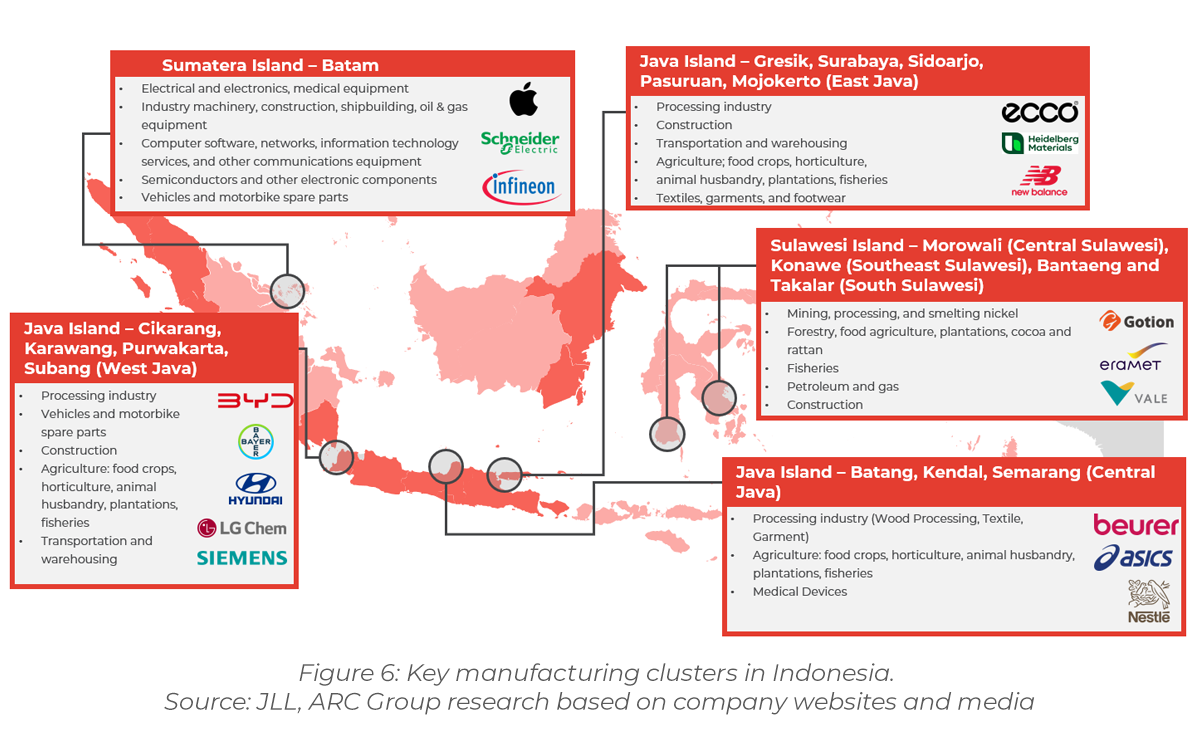
Indonesia’s industrialisation push is anchored in a handful of high-performing regional clusters, each reflecting the government’s long-term industrial roadmap under the Golden Indonesia 2045 vision. These zones are strategically positioned: West Java as the powerhouse of advanced manufacturing; Central Java as a hub for labour-intensive exports; Central Sulawesi for mineral processing and EV input localisation; and Batam as a tech and shipbuilding gateway linked to Singapore. This level of policy signalling provides foreign investors with a clearer blueprint for long-term alignment and scalable localisation.
- West Java (Cikarang, Karawang, Purwakarta, Subang): A leading hub for automotive and electronics manufacturing, home to Bayer, Siemens, Hyundai, BYD and Wuling, etc. Offers strong supplier networks, skilled vocational workforce and proximity to major ports – making it ideal for advanced manufacturing and vehicle assembly.
- Central Java (Batang, Kendal, Semarang): A cost-efficient base for labour-intensive industries such as textiles, furniture and consumer goods with ASICS, Nestlé, etc. Competitive wages and improving transport infrastructure position it as a key export manufacturing zone.
- East Java (Gresik, Surabaya, Pasuruan): A diversified production base serving the construction materials, agribusiness and textile sectors. Backed by mature logistics and large industrial parks.
- Sulawesi (Morowali, Konawe, Bantaeng): A fast-emerging mineral processing and refining cluster centred around nickel – strategic for the EV battery value chain. Hosts major players like Eramet, Gotion and Vale.
- Batam (Riau Islands): Positioned as a trade-access hub near Singapore, Batam leverages tax incentives and a strategic location to attract electronics, shipbuilding and precision engineering investments (Apple Schneider, Infineon, etc.)
2 | Unique strengths drive Sector-Specific Opportunities
Indonesia’s emergence as a manufacturing base is not accidental – it is the product of deliberate policy direction, strategic resource management and regulatory alignment. These three factors – resource depth, industrial policy coherence and local content regulation (TKDN) – are working in tandem to position Indonesia as the industrial heart of ASEAN.
Together, they define Indonesia’s industrial value proposition, shaping where investment is channeled, how localisation is incentivised and which sectors offer the strongest near-term opportunities for international manufacturers. This chapter unpacks each driver, demonstrating how they interact to unlock concrete sectoral entry points.
Indonesia’s Raw Material Base as an Industrial Advantage
Indonesia’s resource base is one of the strongest in the world and a foundational pillar of its industrial competitiveness. The country ranks among the global top three producers of nickel, palm oil, coal, rubber, geothermal and bauxite and holds significant reserves of copper, tin and natural gas.
These domestic inputs offer a threefold cost and compliance advantage: They reduce exposure to imported feedstocks and logistics constraints, enable higher TKDN scores through local sourcing and support vertical integration and drive cluster formation.
Critically, the resource base is actively being leveraged into downstream value creation:
- Nickel and copper underpin EV battery production.
- Palm oil and rubber are essential in chemicals and auto parts.
- Coal and geothermal support energy-intensive industries like cement and electronics.
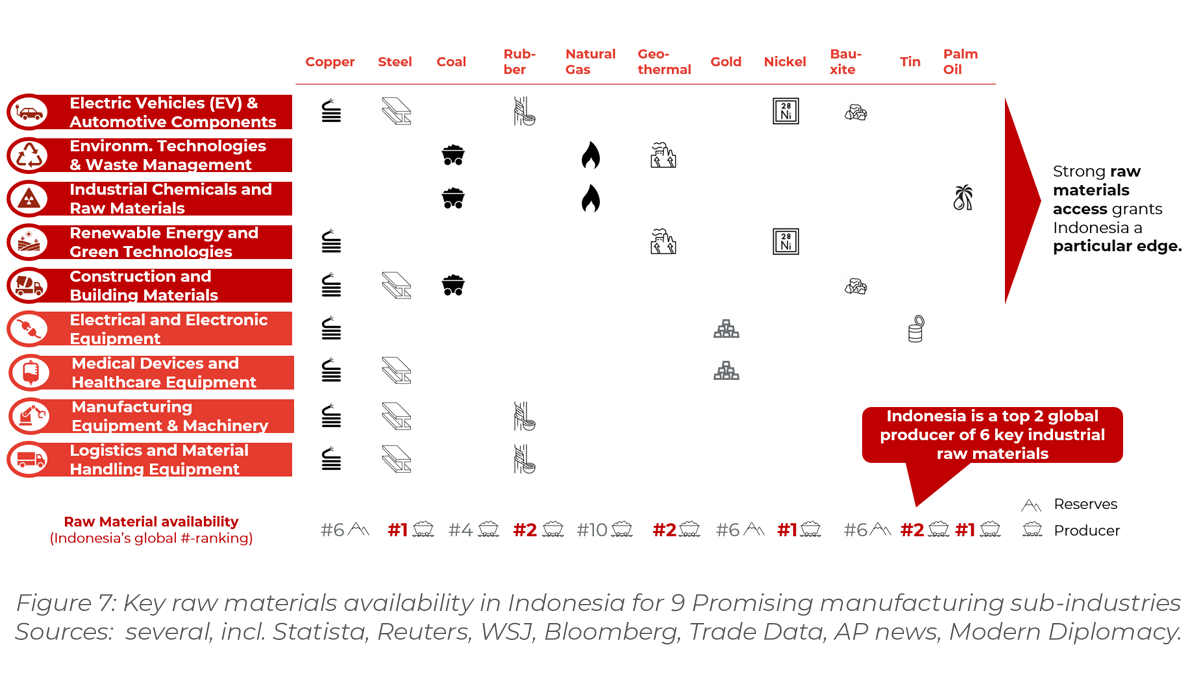
For foreign manufacturers, this depth of raw materials translates into a tangible localisation incentive – especially in sectors where TKDN compliance is required. It also facilitates smoother integration into sectoral clusters, further lowering operating friction and improving eligibility for government incentives.
Industrial Policy: Laying the Groundwork for “Making Indonesia 4.0”
Indonesia’s transformation into an advanced industrial economy is underpinned by a deliberate, multi-layered policy framework. Central to this is the Making Indonesia 4.0 agenda – launched in 2018 to reposition the country as a digitally enabled manufacturing hub. This roadmap provides both strategic direction and operational clarity across four key areas:
- Sectoral prioritisation: Strategic industries such as EVs, electronics, chemicals, food processing and medical devices receive tailored support.
- Investment incentives: Measures such as import duty exemptions, R&D super-deductions and simplified licensing encourage deeper localisation and long-term capital deployment.
- Industry 4.0 enablement: Smart factory pilots, automation grants and digitalisation programs drive productivity and technological upgrading.
- Workforce development: Public-private vocational training schemes aim to close high-tech labour gaps and build future-ready talent.
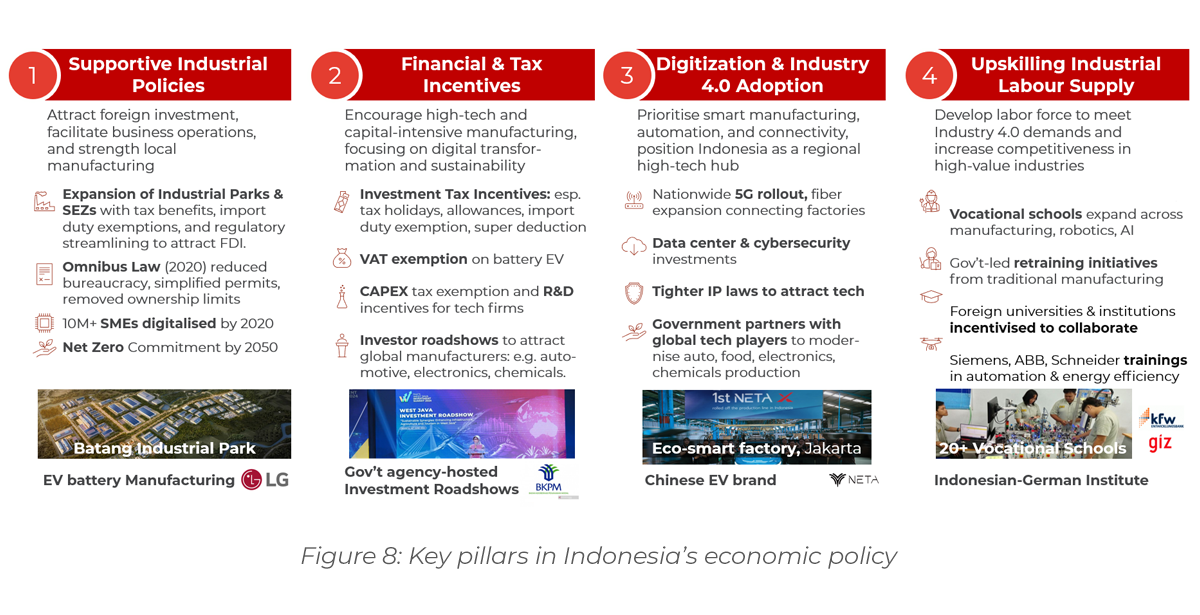
Importantly, this policy agenda does not only enable investment – it directs it. Foreign manufacturers are drawn not only by incentives, but by the predictability, regulatory coherence and infrastructure readiness that characterise Indonesia’s emerging industrial zones.
The result is a more targeted, frictionless investment environment – aligned with national priorities and built for scale. For international firms, this marks a shift: Indonesia is no longer just a low-cost production base, but a credible contender for high-value manufacturing in Southeast Asia. This policy foundation also sets the stage for Indonesia’s more assertive industrial instruments – such as its TKDN local content requirements – explored in the following section.
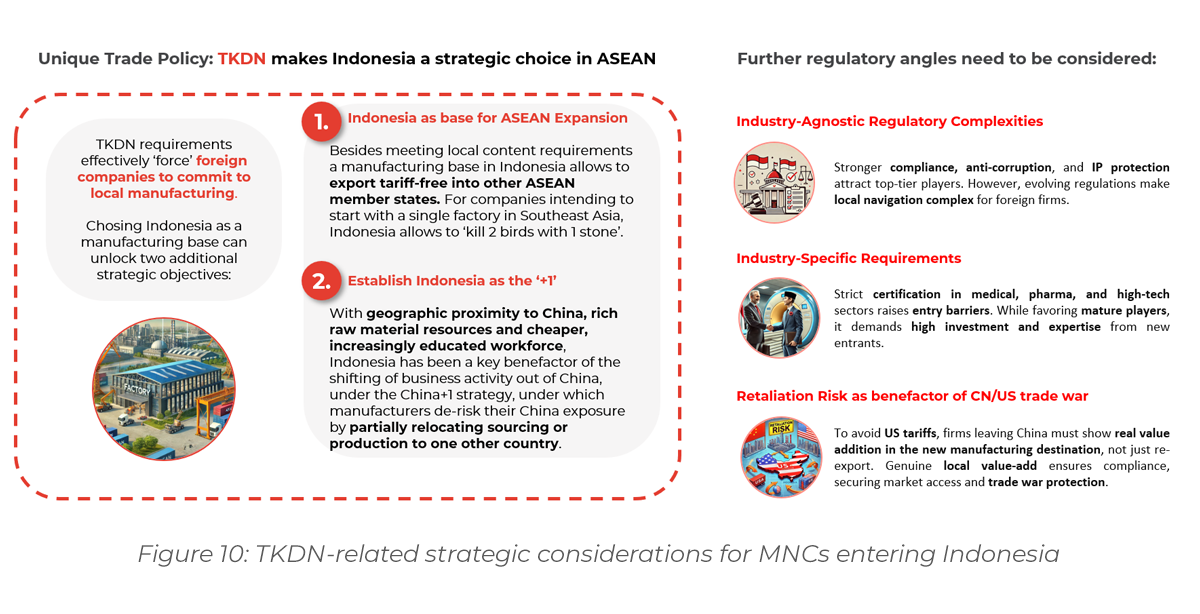
TKDN: With its tightly managed economic opening, Indonesia is following the first-wave Asian industrialisers
Indonesia’s Local Content Requirements (TKDN) represent the country’s most powerful industrial policy tool – designed not merely to protect local firms, but to actively reshape how international companies participate in the national economy.
Rather than imposing blanket mandates, TKDN operates as a sector-specific policy filter, rewarding companies that align early with Indonesia’s development goals. Thresholds vary by industry – typically between 30% and 70%, with some cases (e.g., wind turbines) historically requiring up to 40–70% local share. These thresholds are directly embedded into public tender eligibility, fiscal incentives and sectoral procurement rules.
This strategic logic mirrors industrial policy pathways seen in East Asia. In the 1990s and 2000s, China used local content mandates to build competitiveness in wind, solar and telecom – often requiring 40–70% local content in priority sectors. Japan, Korea and Taiwan followed a similar trajectory: coupling early-stage protection with performance incentives and export discipline allowed to build domestic capabilities along key supply chains, moving subsequently from less complex to higher value added activities, before gradually liberalising once domestic capabilities matured[4].
Indonesia is now adapting that playbook to its context. Sectors deemed strategic – such as EVs, healthcare and energy infrastructure – are steered toward national self-reliance and deeper domestic participation. For companies with credible localisation strategies, TKDN provides a clear route to procurement access, regulatory alignment and long-term relevance.
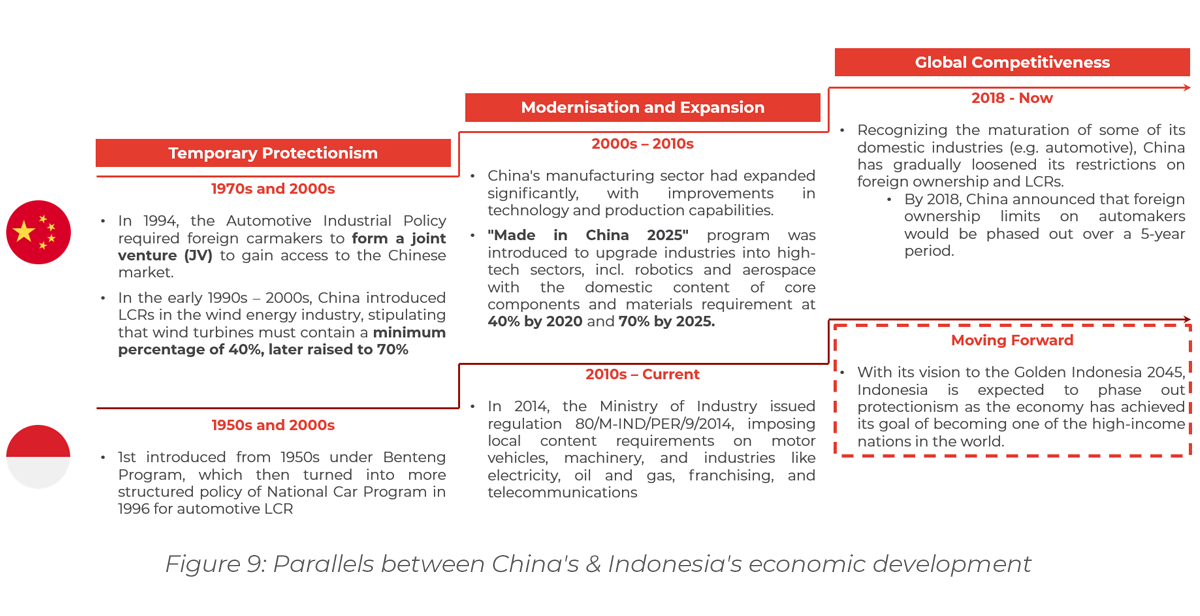
What sets Indonesia apart from regional peers such as Vietnam or Thailand is this policy sharpness. The country does not merely encourage local production – it mandates local content requirements in high-growth sectors.
As a result, consolidating ASEAN operations in Indonesia is emerging as a preferred strategy. It allows firms to comply with TKDN, access incentives and build region-wide scale leveraging e.g. ASEAN and RCEP free trade agreements – while duplicating investments across non-TKDN markets like Vietnam may forgo those policy-driven advantages, particularly as TKDN becomes a prerequisite for participating in the country’s long-term industrial opportunity.
More than a protectionist tool, TKDN is a strategic industrial lever: a selective filter for market participation that not only guides how, where and by whom value is created within Indonesia’s borders – but also provides a graduated shield for Indonesian companies, offering protection in proportion to their stage of international competitiveness.
Sector spotlight: Industrial goods segments positioned to benefit
With raw materials, policy and localisation mechanisms working in tandem, Indonesia is emerging as a magnet for B2B industrial investment. The interaction of these three pillars defines nine sectors that in our view stand to benefit most, which we introduce in Figure 11: B2B Industrial Goods: Rapidly expanding ecosystem across the industrial value chain. Specifically, we profile below five strategic segments where market demand, policy visibility and localisation feasibility align – offering compelling entry points for multinational manufacturers:
- EVs & Automotive Components: The country is targeting 140 GWh of EV battery production by 2030 – approximately 4–9% of global capacity. By the same year, the aim is to have 2 million electric cars and 12 million electric two-wheelers on the road. Drawn by local content incentives and access to raw materials like nickel, global players are already investing across the value chain into what will be one of Asia’s top 3 EV markets by 2030 outside of China.
- Environmental Technologies & Waste Management: Projected to reach USD 12.45 billion by 2029, the waste management market is expanding due to urban growth, tightening regulations and ESG expectations. This growth presents opportunities in waste-to-energy, recycling and water treatment systems, particularly when foreign technology is integrated with local execution.
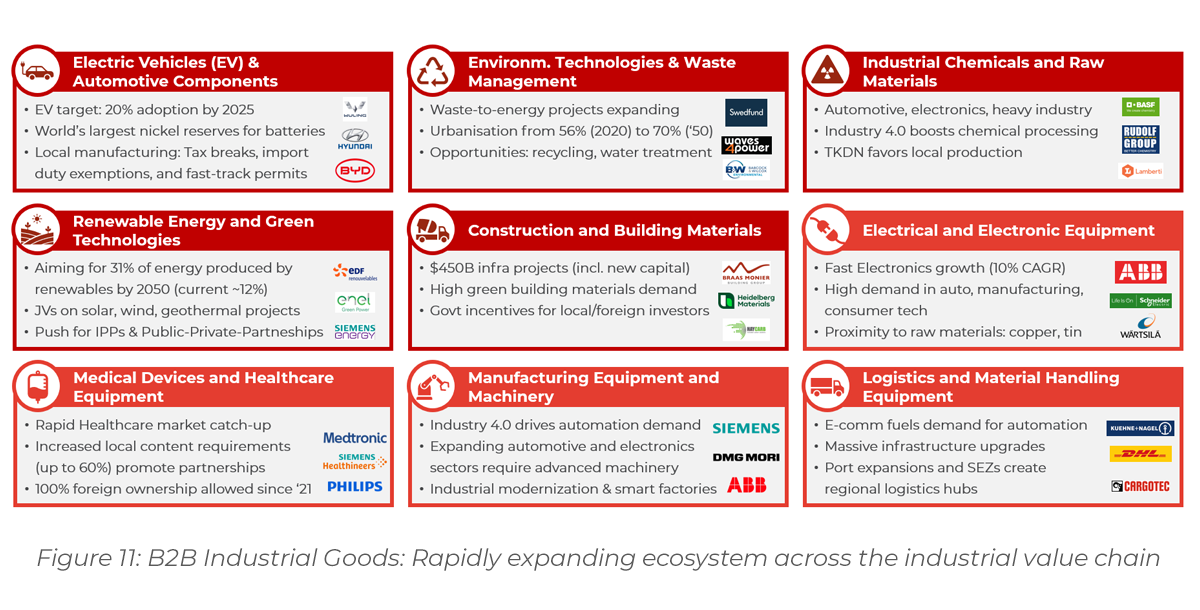
- Chemicals & Raw Materials: Proximity to feedstocks like palm oil, rubber and coal provides a cost advantage for upstream processing. For instance, BASF and Eramet are investing USD 2.6 billion in a plant in Halmahera to produce nickel and cobalt for EV batteries, effectively localising industrial chemical production.
- Renewable Energy: The energy transition is accelerating, driven by goals for energy security and local content alongside climate commitments. Power generation from renewables is expected to more than double from 47.9 TWh in 2023 to 116.6 TWh by 2032. Independent Power Producers (IPPs) are expanding in geothermal, solar and wind sectors, supported by favorable procurement frameworks and TKDN-linked incentives.
- Construction & Building Materials: Public infrastructure spending accounts for 2.4% of GDP, surpassing the ASEAN average of 1.8%, which highlights a strong commitment to development. Projects such as the construction of the new capital and upgrades to logistics networks are increasing demand for locally produced cement, steel, prefabricated components and engineering services, especially in initiatives linked to TKDN procurement.
Government incentives for sector collaboration are fostering the gradual, step-by-step advancement of local firms across the value chain
Across these segments, international companies – particularly from Europe, Korea and China – are increasingly localising parts of their value chains. Western firms tend to concentrate on high-tech subsegments, often entering through joint ventures or strategic partnerships. Korean and Chinese players, by contrast, frequently lead in volume-driven industrial plays, where lower product complexity facilitates more direct modes of market entry.
Common approaches include joint ventures, component reassembly and fully integrated facilities. The trend is consistent: firms that engage early with localisation requirements tend to be better positioned in public procurement, gain regulatory goodwill and establish long-term advantages in policy-aligned sectors.
For instance, Hyundai’s investment in its USD 1.55 billion EV plant in West Java not only met Indonesia’s local content (TKDN) targets but also secured strong support from the government, including EV ecosystem incentives and favorable procurement conditions. By localising battery assembly and partnering with local firms, Hyundai achieved early-mover status in Indonesia’s EV sector – a position that competitors are now racing to catch up with. In turn, it provided local actors with demand for high quality parts and services. This reflects a broader pattern: strategic localisation is no longer optional – it’s a key lever for market access and competitive differentiation in Indonesia’s industrial future.
3 | Decoding TKDN: Strategic Intent and Mechanism
As not last the case of Hyundai has shown, building on Indonesia’s broader industrial transformation, TKDN acts as the regulatory backbone to incentivise international firms to participate in the country’s growth trajectory.
This chapter unpacks the intent, calculation mechanisms and enforcement logic of Indonesia’s TKDN policy – explaining how it shapes market access, incentivises localisation and creates strategic implications for companies in priority sectors. Key case applications are analysed in Chapter 4.
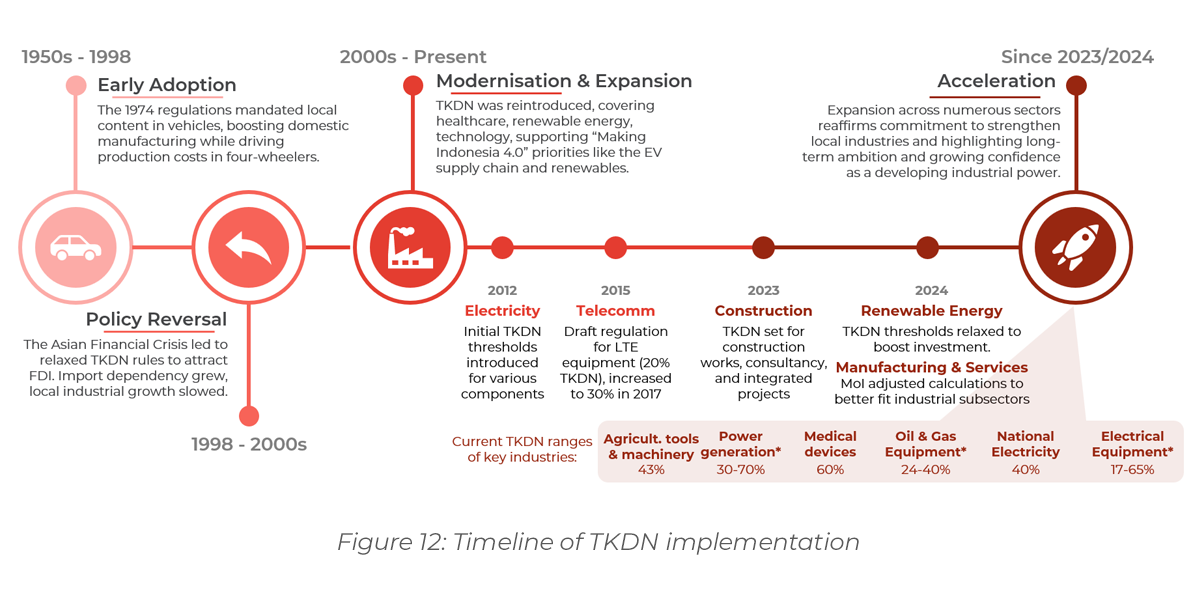
From Vision to Policy: TKDN as a Strategic Industrial Lever
Indonesia’s Tingkat Komponen Dalam Negeri (TKDN), or Local Content Requirement (LCR) policy is a long-standing localisation framework designed to shape how international firms engage with its economy. First introduced in the 1970s and broadened several years after the Asian Financial Crisis in 1997/98, the policy has evolved from sectoral mandates into a national tool for industrial development.
In its current form, TKDN serves a dual purpose:
- As a strategic development tool, it incentivises international firms to invest in local production capabilities and contribute to the country’s industrial ecosystem.
- As a market access filter, it favours firms that align with national industrial goals and rewards them with priority access to tenders, incentives and preferential treatment.
This dual role reflects Indonesia’s wider industrial vision under the “Making Indonesia 4.0” and “Golden Indonesia 2045” roadmaps. TKDN is the mechanism that links this ambition to execution – providing clarity on participation terms, incentivising localisation and strengthening domestic supply chains.
While some industries face strict thresholds – e.g. 80% minimum local content required for medical devices and between typically 30 and 70% for various forms of power equipment – the broader trend is clear: compliance is being gradually tightened, not just to protect local firms, but to structure foreign investment in line with national objectives.
For firms seeking sustained presence in Indonesia, TKDN is not an optional hurdle. It is a strategic blueprint that determines how value is created, captured and rewarded in one of ASEAN’s most ambitious industrial economies. The most recently established thresholds (2023–2024) signal a consistent, long-term direction of increasing localisation demands.
How TKDN Operates: Calculation Logic and Certification
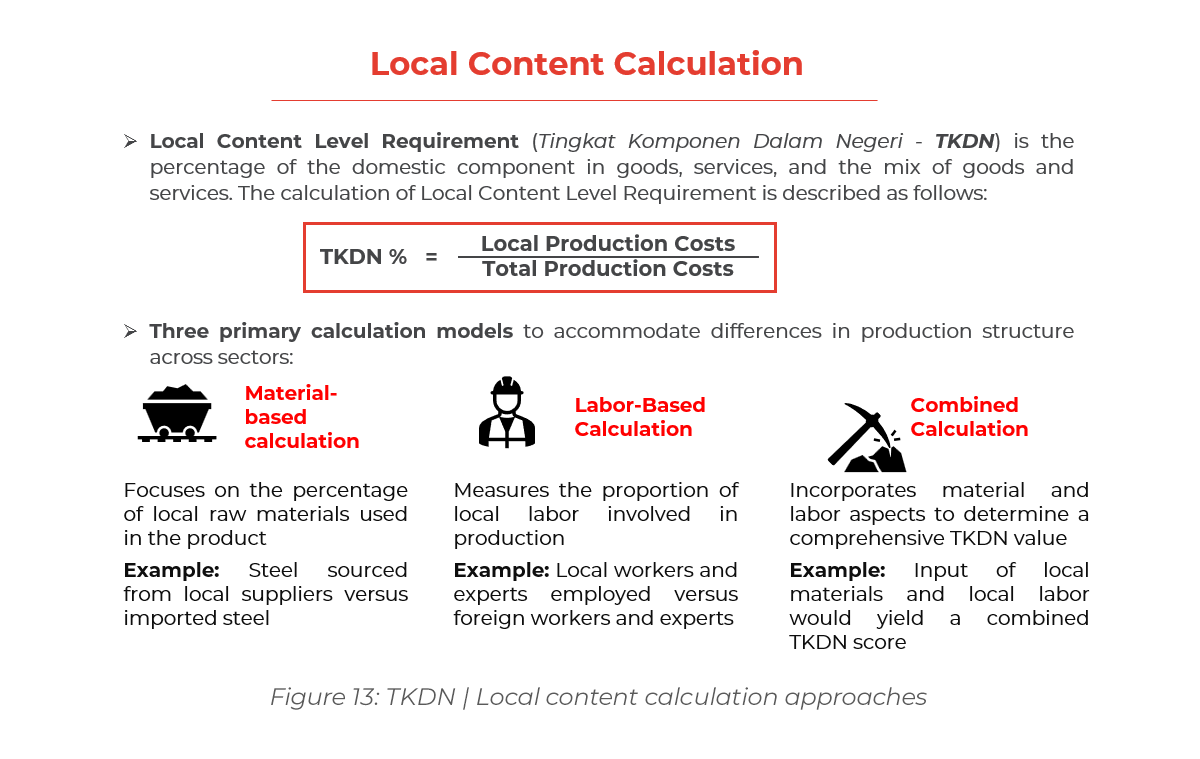
1. Calculation of the domestic value added
Calculating the local content % (TKDN) involves quantifying the share of domestic value embedded in goods and services sold in Indonesia. This includes locally procured materials, components, labor, R&D and production processes. Depending on the product category, the Ministry of Industry or other sectoral regulators apply one of three main calculation models (refer Figure 13: TKDN | Local content calculation approaches).
Dedicated investments in local R&D or manufacturing capabilities can also count toward TKDN scores, though subject to sectoral approval. The R&D plant proposed by Apple to lift local content share could be an example if eventually approved.
2. Certification process
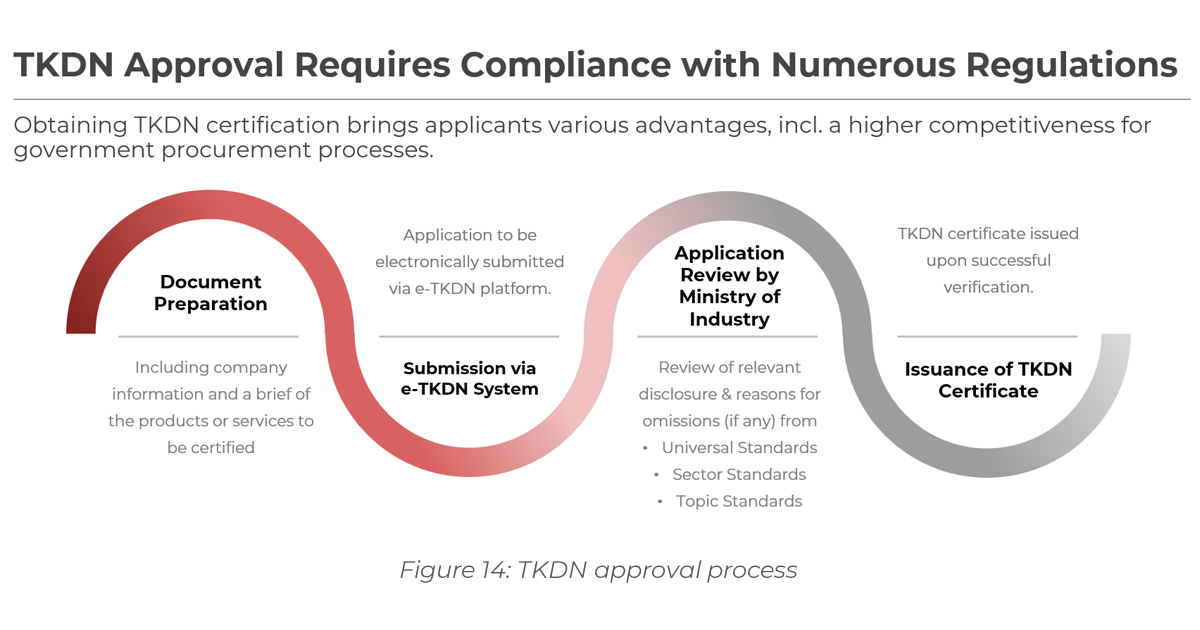
Certification is obtained via the e-TKDN platform and involves (refer Figure 14):
- Document preparation and Bill Of Materials (BOM) disclosure
- Online submission via e-TKDN
- Application review and audit by the Ministry of Industry or other designated bodies
- Issuance of TKDN certificate
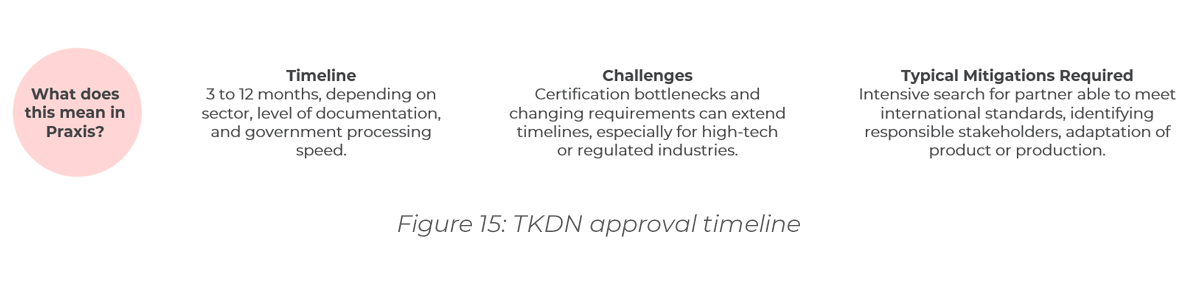
The timeline to obtain the TKDN certificate ranges typically from 3 to 12 months depending on sector and documentation readiness. Delays are frequently caused by regulatory ambiguity, changing standards or missing data. Firms can mitigate risk by engaging with local advisors and verifying their Bill Of Materials (BOM) assumptions in early pilot runs.
Regulatory Fragmentation: Navigating a Multi-Ministerial Landscape
Beyond mastering the technical aspects of TKDN calculation and certification, companies must also navigate a complex institutional environment. TKDN is not overseen by a single authority – it is administered across multiple ministries, each applying its own methodology, documentation requirements and approval logic.
Multi-Ministerial Oversight
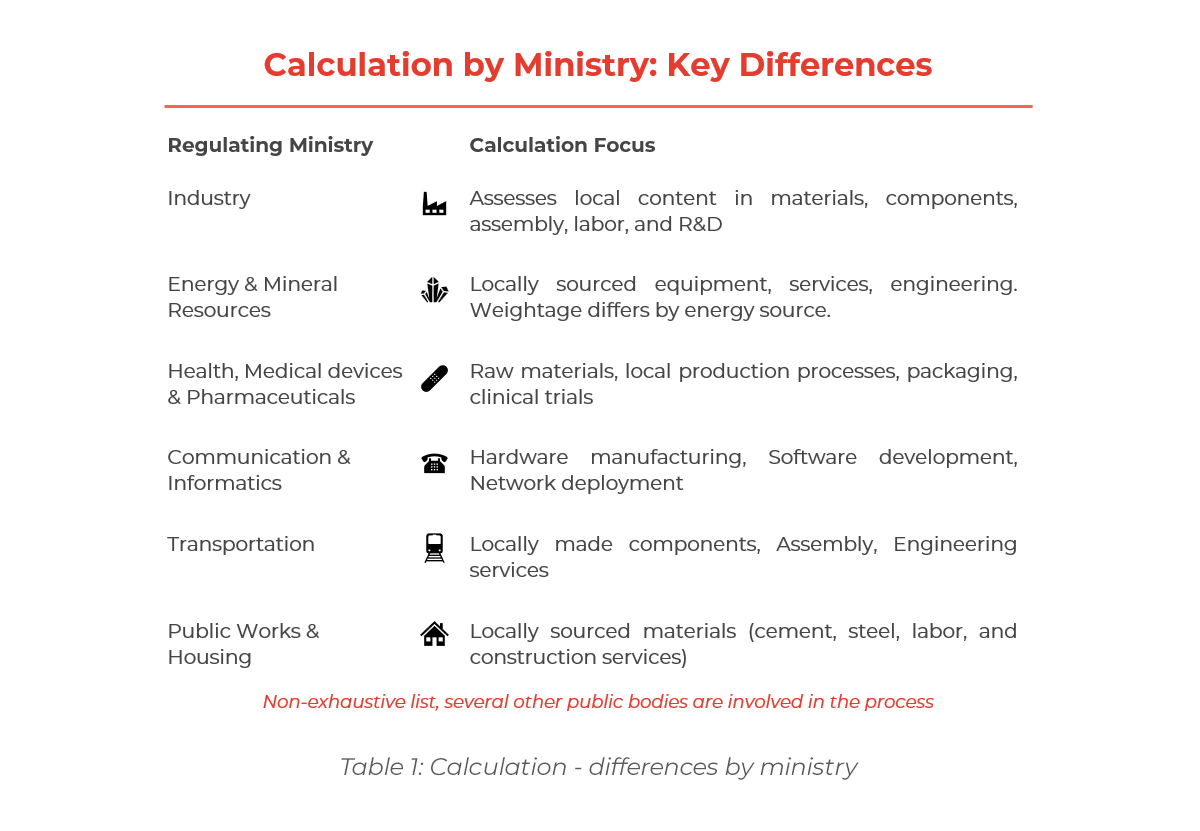
While the Ministry of Industry (MoI) governs most manufacturing-related categories, other ministries enforce TKDN requirements in their respective domains, key examples are depicted in Table 1.
body applies different calculation models (material-, labour- or service-based) and certification pathways, which can lead to procedural inconsistencies even for similar products.
Methodological Divergence
Each regulator determines its own weighting logic for local value. For instance:
- Kominfo may prioritise software development and device testing.
- ESDM places greater emphasis on engineering services and domestically sourced components.
This variation affects how companies structure their Bill of Materials (BoM) and plan localisation milestones.
Strategic Navigation of Certification
Successfully navigating this fragmented landscape requires a sequenced and strategic approach, ideally involving:
- A mapping of product lines to relevant ministries to understand the applicable TKDN logic early in the market entry process,
- Sequenced certifications, starting with pilot SKUs under more predictable ministries and
- Deliberately designed localisation plans to align with ministries that offer faster certification, clearer documentation standards, or stronger incentive linkages.
4 | Navigating TKDN: Strategic Pathways and Compliance
With the opportunities in Indonesia localised more specifically and the TKDN logic and institutional landscape clarified, we turn from analysis to application. This chapter equips firms to translate the policy into viable entry strategies – mapping five common localisation models and outlining key steps to secure TKDN certification. Whether pursuing joint ventures or full in-country production, firms must navigate this frame-work strategically to unlock market access, policy incentives and long-term position-ing.
Strategic Entry Pathways: Matching Models to Localisation Needs
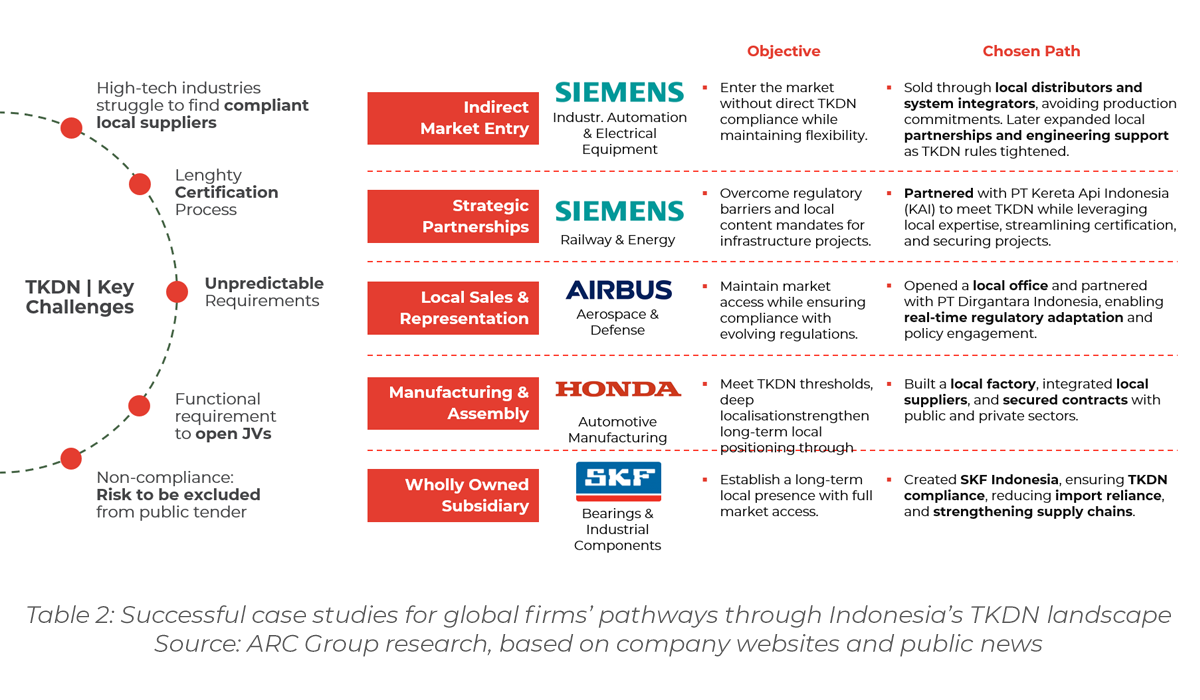
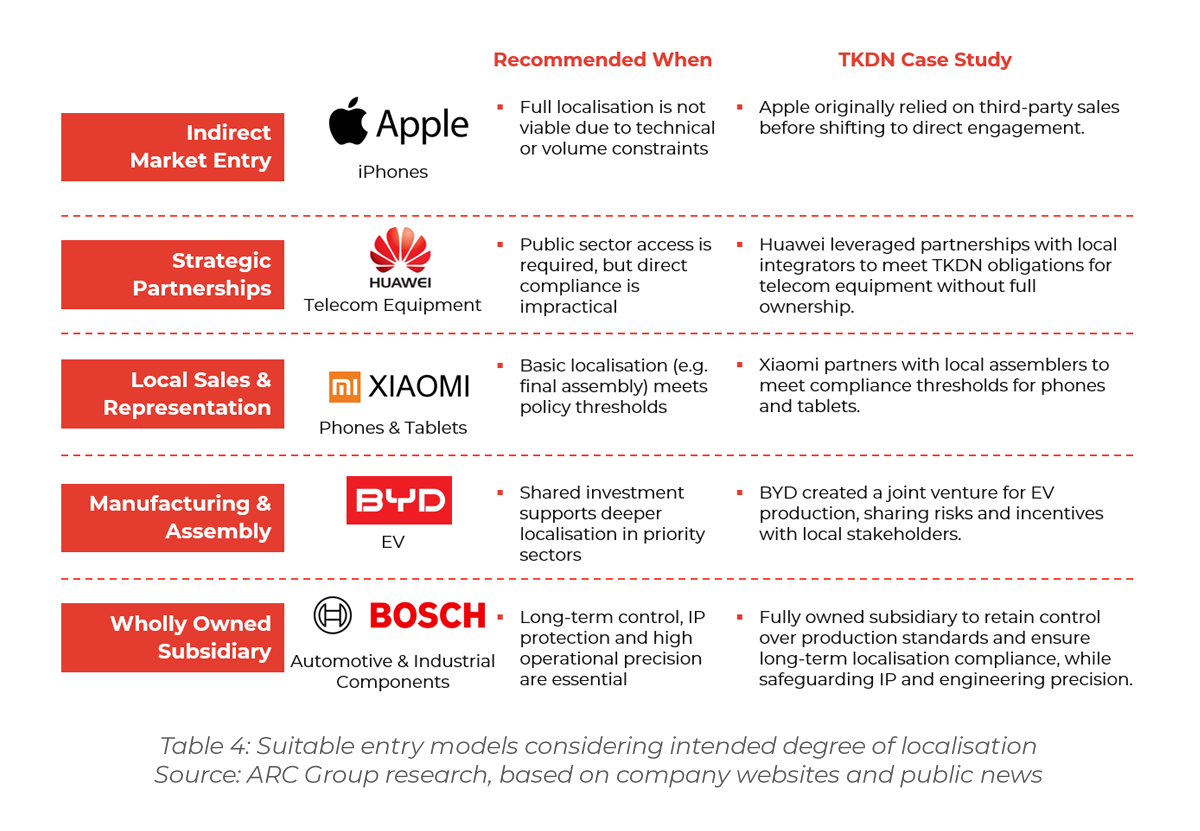
Companies entering Indonesia must align market access ambitions with their ability to meet TKDN requirements. Based on the individual challenges to be solved, five entry models are most commonly applied (refer to Table 2 for examples).
1. Indirect Market Entry
Used when localisation is technically unfeasible or commercially unjustified due to volume constraints or certification barriers. Companies may rely on exports or work with local distributors while focusing on segments where TKDN compliance is not mandatory.
Case Study: Siemens Smart Infrastructure continues to serve Indonesian clients in the private sector through international exports and partnerships with local sales channels. This allows Siemens to retain market presence without engaging in burdensome localisation procedures.
2. Strategic Partnerships
Best suited for companies that need access to public tenders but cannot achieve direct compliance. Partnering with certified Indonesian firms allows shared compliance and indirect access to TKDN benefits.
Case Study: Siemens Energy partners with local EPC contractors and state-owned enterprises to meet public sector localisation requirements while advancing broader infrastructure goals. This model is especially relevant in energy, defence and heavy equipment.
3. Local Sales & Reassembly
Applied when companies can meet TKDN thresholds through basic domestic activities such as assembly or testing. This protects intellectual property and maintains global production standards while securing local compliance.
Case Study: Airbus uses local reassembly partners to localise key product lines, gaining access to defence and aviation procurement. This approach allows flexible compliance in high-spec industries.
4. Manufacturing & Assembly Joint Ventures
Ideal in sectors where policy support and consumer demand justify deeper localisation. Joint ventures share the burden of compliance, capital and integration into local supply chains.
Case Study: BYD and Wuling, both active in Indonesia’s EV market, use JV models to gain scale advantages while qualifying for industrial incentives. This approach is common in EVs, automotive and heavy manufacturing.
5. Wholly Owned Subsidiary
Recommended when long-term control over quality, certification and IP is essential. Full ownership allows full compliance planning, investment in local capabilities and maximum strategic flexibility.
Case: Swedish engineering company SKF, specialising in bearings and precision components, has established a wholly owned manufacturing operation in Indonesia. This allows SKF to directly manage operations, develop a local supplier base and align Bill of Materials (BoM) planning with TKDN thresholds. This is particularly relevant in industries requiring high-spec engineering or where future scaling is expected.
Certification Requires Planning, Process Discipline and Local Insight
Once obtained, the TKDN certification offers access to tenders, incentives and increased market visibility – but navigating it requires procedural rigour. As discussed in chapter 3, compliance consists of four main stages and ideally takes 3 months.
In practice, delays are common due to mismatched Bill of Materials (BoM) disclosures, unclear documentation, or evolving regulations. Challenges are particularly acute in sectors governed by high-tech standards or involving multiple certifying bodies.
Typical blockers include:
- Incorrect or incomplete Bill of Materials (BoM) breakdown
- Discrepancies in production cost data
- Late-stage rejections due to misunderstanding of the applicable TKDN model (material-based, labour-based, or combined)
To reduce risks, firms often start with one pilot stock keeping unit (SKU) to build familiarity before scaling compliance across product lines. Local advisers are essential to help MNCs interpret regulation nuances, engage with certifying bodies (e.g., Sucofindo or the Ministry of Industry) and streamline documentation.
Certification success hinges on internal ownership and early cross-functional alignment across operations, finance and business development teams.
Strategic Value Drivers Behind Localisation Decisions
While compliance is table stakes to doing business in Indonesia, TKDN is increasingly interpreted as a lever for strategic positioning. Table 3 summarises four major reasons why companies localise under TKDN – each illustrated by a leading international case.
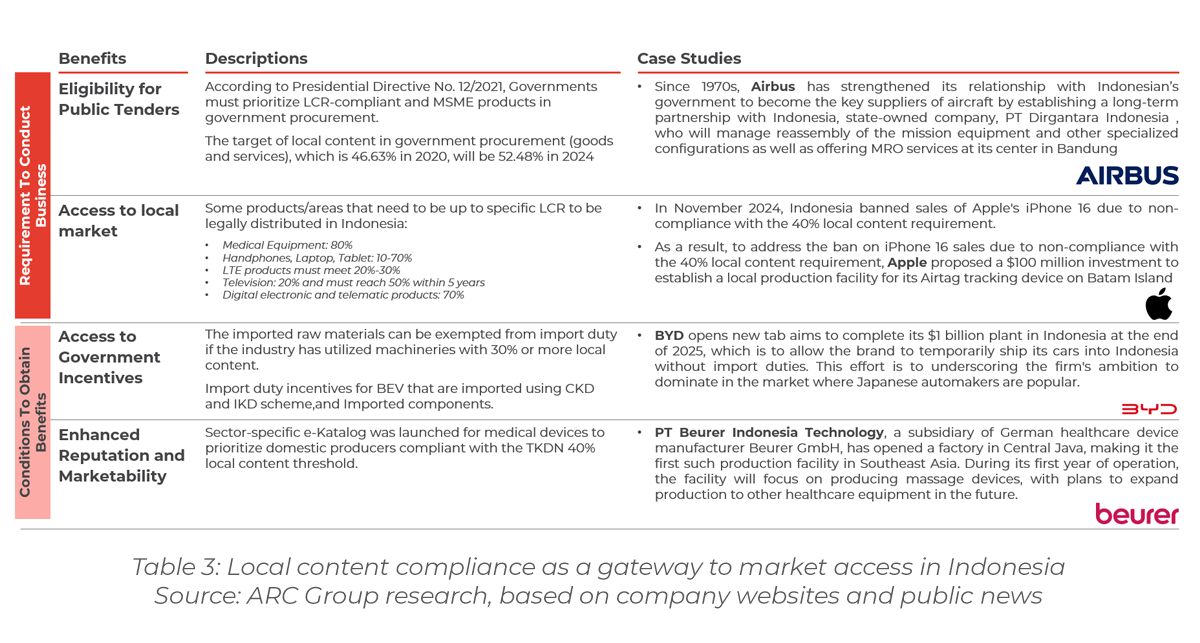
Apple’s case illustrates how compliance can be achieved through phased and negotiated localisation. In 2024, Apple faced a temporary sales ban on its iPhone 16 due to non-compliance with the 40% TKDN threshold. Initial efforts, including a USD 10 million investment in R&D and training, fell short of government expectations. To regain market access, Apple significantly raised its localisation commitment – announcing a USD 1 billion plan, which involved three parts including 1) establishing a production facility in Batam, focused on AirTag manufacturing, 2) “component and accessories” factory and 3) training and tech education via the Apple Developer Academy and Apple Innovation and Technology Institute. After many rounds of negotiation, the saga reached denouement on February 26th, with a USD 320 million investment deal inked by Apple and the government[5].
The Apple case offers two key lessons:
- Compliance requires communication: TKDN alignment is not fixed to rigid templates, but allows for negotiated, step-by-step commitments – especially when firms demonstrate strategic intent and ecosystem contribution.
- When approached strategically, compliance can motivate strategic decisions that can ultimately help companies develop a thorough on-the-ground market intelligence which can prove beneficial in capturing value in this rapidly growing future mega consumer market.
5 | Strategic Playbook for TKDN Compliance
Finally, we want to leave companies with a structured framework to successfully localise operations in Indonesia under TKDN. The process is not merely about meeting compliance thresholds – it’s about aligning localisation strategy with commercial goals, risk tolerance and long-term industrial positioning. Each step builds clarity, ensures cross-functional buy-in and de-risks execution.
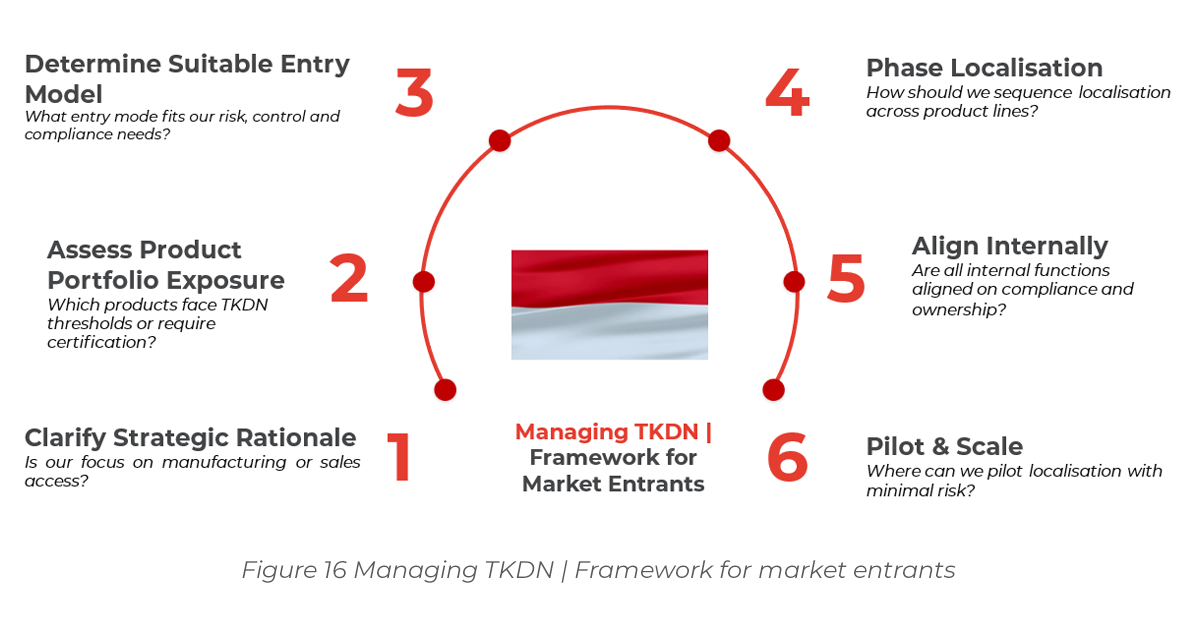
1) Clarify Strategic Rationale
Any successful localisation strategy begins with defining the core objective of entering Indonesia. Is the intent to build a long-term manufacturing base and benefit from incentives? Or is the aim to sell into the Indonesian market – potentially via public procurement?
- Firms focused on production, like BYD, entered Indonesia to establish a strategic EV hub, using TKDN compliance to unlock incentives and build a resilient regional base.
- In contrast, Apple initially focused on sales, attempting to access the market without direct localisation. The company only shifted toward manufacturing after facing a temporary market ban due to non-compliance.
- This distinction determines the depth, structure and urgency of localisation – and should be the first step in any TKDN-related roadmap.
2) Assess Product Portfolio Exposure
The next step involves mapping product lines against TKDN exposure:
- Are thresholds legally required for market access?
- Is the product relevant for public tenders or e-Katalog listings?
- Which ministry regulates the sector and what methodology applies?
Products can be categorised into:
- Localise Immediately – high relevance and feasibility
- Phase Over Time – future potential, currently low readiness
- Exclude or Deprioritise – limited exposure or low strategic importance
Beurer, the German medical device company, used this lens to identify which devices to localise. Its priority was products relevant to public tenders with 40%+ thresholds. Similarly, Samsung identified phones and tablets as priority categories due to e-Katalog demand and mandatory TKDN thresholds of up to 70%.
3) Determine Suitable Entry Model
Choosing the right market entry mode depends on TKDN requirements, technical feasibility and internal capabilities. Each model offers a trade-off between speed, control, cost and compliance.
This decision is not binary – companies often evolve from indirect entry to deeper localisation as operations scale and ecosystems mature.
4) Define a Phased Localisation Roadmap
Localisation should unfold in sequenced stages, guided by product readiness, cost structures and supply chain capacity.
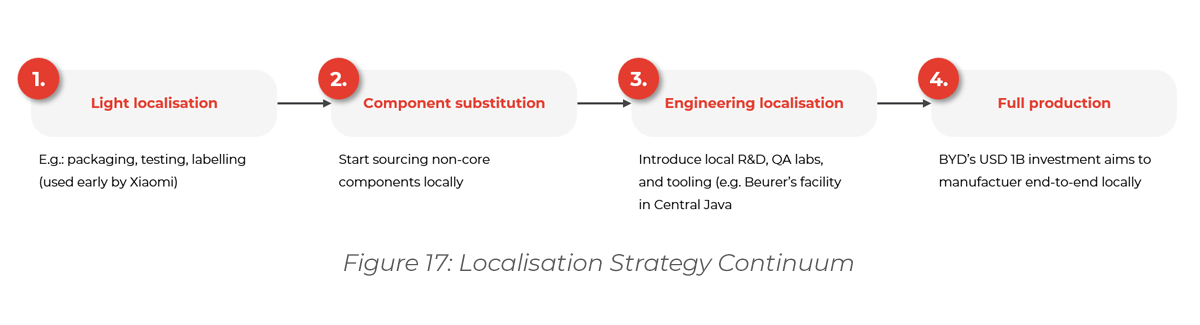
Progress across these stages is not always linear. The roadmap should match both internal capacity and evolving TKDN thresholds.
5) Establish Internal Cross-Functional Alignment
Meeting TKDN requirements is not just a compliance task – it requires coordination across engineering, procurement, tax, legal, finance and BD.
BYD is a textbook case of internal alignment. From day one, it integrated localisation targets into facility design, procurement policies and tax optimisation. This cross-functional coordination enabled BYD to act decisively, secure incentives and move quickly toward full compliance.
By contrast, Apple’s delayed investment in Batam illustrates the risk of fragmented internal ownership and lack of early engagement. Multiple internal teams – government affairs, supply chain and product compliance – operated in silos. This misalignment delayed a proactive localisation strategy. When the government enforced a ban on the iPhone 16 in 2024 due to TKDN non-compliance, Apple was forced into reactive negotiations. The result: a rushed, high-cost pivot toward compliance, including a $10 million investment in a Batam production facility. Had strategic localisation been prioritised earlier, Apple could have avoided both reputational damage and costly disruption[6].
Companies should assign a TKDN “owner” within the organisation, responsible for budget alignment, certification planning and stakeholder coordination.
6) Pilot, Certify and Scale
Companies are advised to test localisation in a low-risk setting before committing large-scale resources.
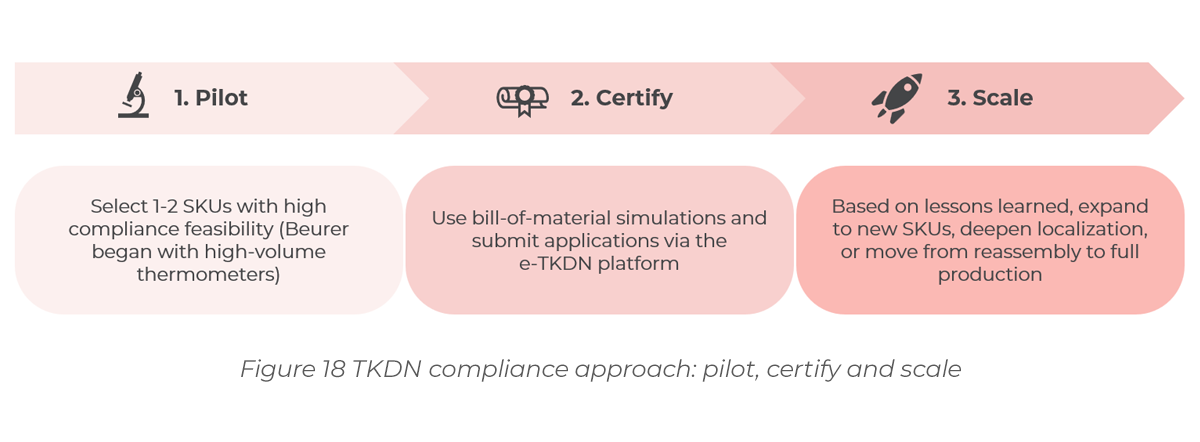
This stepwise approach allows for learning, reduces the risk of certification failure and demonstrates credible engagement to regulators.
| Conclusion
From Compliance to Competitive Positioning
Indonesia is no longer just a low-cost production option – it is emerging as a strategic manufacturing base for Southeast Asia. Its assertive industrial policy, resource depth and growing market size position it as a serious contender for regional leadership, accelerated from global tailwinds like China+1 and Southeast Asia’s attractive positioning as a peaceful and diplomatically independent region.
TKDN is central to this shift. Rather than being a bureaucratic requirement, it is the mechanism through which the government is shaping who gets to participate in the country’s next growth phase. Like China and Korea in earlier decades, Indonesia is using localisation policy to build domestic capabilities, drive investment into key sectors and create regional champions.
The companies that succeed treat TKDN as a strategic framework to align operations with market access, incentives and long-term growth. This requires early product mapping, internal alignment, smart entry structuring and a phased localisation roadmap. It also requires local insight and hands-on execution – because success is determined not only by planning, but by your ability to deliver in-market.
Indonesia is rising. TKDN is the rulebook. And for global industrial firms that act early and decisively, the opportunity is substantial: a scalable ASEAN base, privileged access to one of the world’s largest consumer markets and a voice in shaping the future of the region’s industrial economy.
Verdict: While the regulatory process appears structured, much of the complexity lies between the lines. Ultimately, those who approach TKDN as an integrated, cross-functional transformation – not simply a procurement requirement – will be best placed to capture Indonesia’s growth potential in the decade ahead.
Download
Click here to download this article as a .pdf document.
Contributor:
Daniel Karlsson
Partner
Contributor:
Leo Jibrandt
Associate Partner
Contributor:
Ralf Wasmuth
Associate
Contributor:
Alex Tran
Analyst
References
[1] Funding Indonesia’s Vision 2045 – World Bank
[2] Global Affairs Canada Website
[3] BPS – Statistics Indonesia. Numbers vary significantly across various sources, depending on detailed scope, esp. as some sources include interprovincial investments.
[4] Joe Studwell provides extensive background in his book ‘How Asia Works’.
[5] [6] The Economist news